> ## Documentation Index
> Fetch the complete documentation index at: https://docs.auxia.io/llms.txt
> Use this file to discover all available pages before exploring further.
# Engagement
> Measuring impact across key metrics
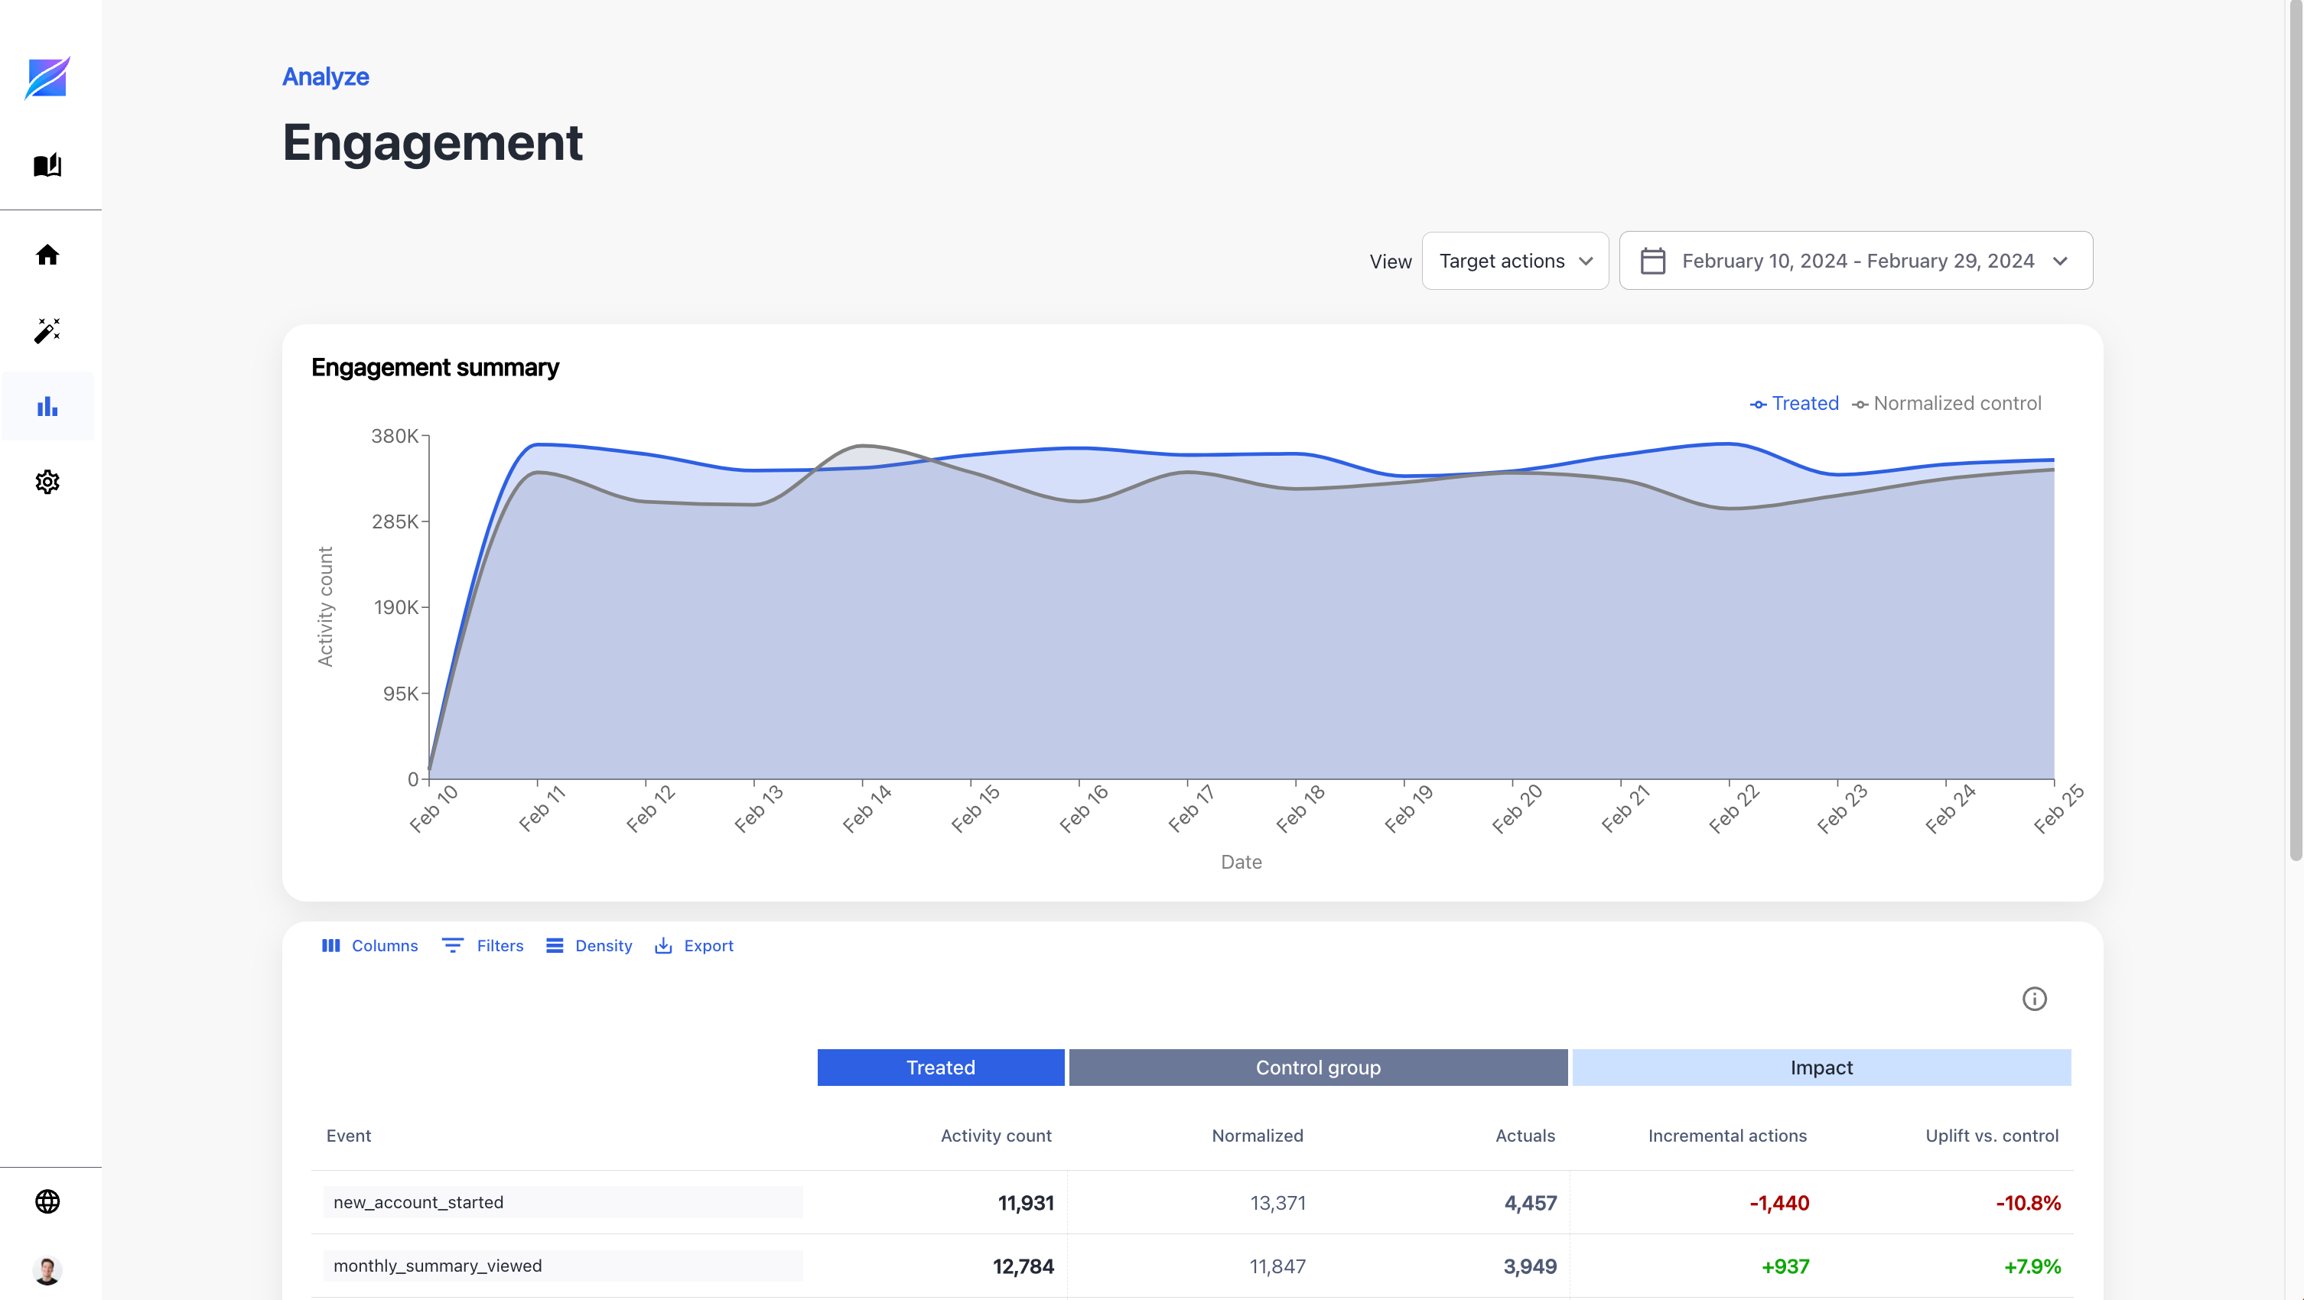 The **Engagement** page provides a consolidated view of Auxia's overall impact on key user behaviors and metrics. Unlike the **Interactions** and **Adoptions** dashboards, which highlight the relative impact across different treatments, this dashboard focuses on the **total effect** of running Auxia across your organization's most important KPIs—such as **target actions** (e.g., "purchase completed") and **guardrail metrics** (e.g., "item likes", "items saved").
## Data Structure
The Engagement dashboard contains the following columns:
| **Column** | **Description** |
| -------------------------------- | ------------------------------------------------------------------------------------------------------------------------------------------- |
| **Event** | The specific user action ingested from your data sources. |
| **(Treated) Activity Count** | The total number of times users in the **treated group** performed the event. A treated user is one who has received a response from Auxia. |
| **(Control) Actual Count** | The total number of times users in the **control group** performed the event. A control user has not received any response from Auxia. |
| **(Control) Normalized Count** | The control count adjusted for group size imbalance: *Control Actual Count × (Treated Group Size / Control Group Size)*. |
| **(Impact) Incremental Actions** | The difference between treated activity count and normalized control count. |
| **(Impact) Uplift vs. Control** | The percentage increase of treated over normalized control: *(Incremental Actions ÷ Normalized Control Count) × 100*. |
## Computation Logic
The Engagement dashboard computes daily aggregates of the number of events that occurred during the specified time period in the date range.
## Key Attribution Rules
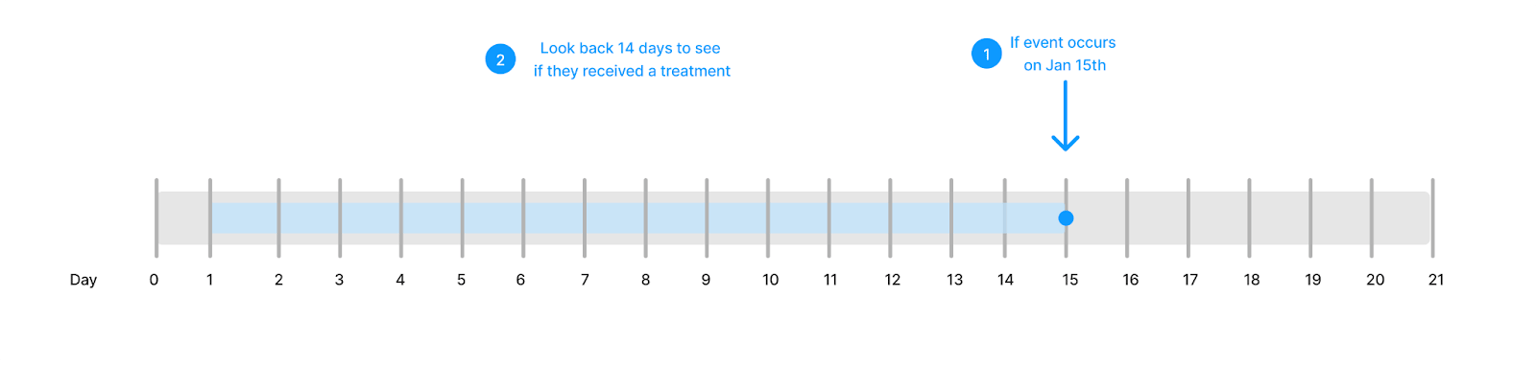
* **Daily Aggregation:** The dashboard reports **daily aggregates** of each event during the selected date range.The diagram below highlights an example of how the daily aggregates are computed.
The **Engagement** page provides a consolidated view of Auxia's overall impact on key user behaviors and metrics. Unlike the **Interactions** and **Adoptions** dashboards, which highlight the relative impact across different treatments, this dashboard focuses on the **total effect** of running Auxia across your organization's most important KPIs—such as **target actions** (e.g., "purchase completed") and **guardrail metrics** (e.g., "item likes", "items saved").
## Data Structure
The Engagement dashboard contains the following columns:
| **Column** | **Description** |
| -------------------------------- | ------------------------------------------------------------------------------------------------------------------------------------------- |
| **Event** | The specific user action ingested from your data sources. |
| **(Treated) Activity Count** | The total number of times users in the **treated group** performed the event. A treated user is one who has received a response from Auxia. |
| **(Control) Actual Count** | The total number of times users in the **control group** performed the event. A control user has not received any response from Auxia. |
| **(Control) Normalized Count** | The control count adjusted for group size imbalance: *Control Actual Count × (Treated Group Size / Control Group Size)*. |
| **(Impact) Incremental Actions** | The difference between treated activity count and normalized control count. |
| **(Impact) Uplift vs. Control** | The percentage increase of treated over normalized control: *(Incremental Actions ÷ Normalized Control Count) × 100*. |
## Computation Logic
The Engagement dashboard computes daily aggregates of the number of events that occurred during the specified time period in the date range.
## Key Attribution Rules
* **Daily Aggregation:** The dashboard reports **daily aggregates** of each event during the selected date range.The diagram below highlights an example of how the daily aggregates are computed.
 * **Group Attribution:**
* The user activities are attributed only after a user receives a **first Auxia response of the day.**
* **Example:** If a user's first treatment occurs at 1:00 PM on January 12, all activities from 1:00 PM on January 12 through the next 13 days are attributed to that treatment.
* If the user's next treatment is on January 27, any activities between the end of the 13-day window (after January 25) and the time of the January 27 treatment are **not** attributed to Auxia.
* Users are classified as **treated** or **control** based on the experiment setup.
* **Treated group user:** The Engagement dashboard only counts events that occurred if a user received a treatment less than 14 days before.
* **Control group user:** The dashboard only counts events that occurred if the user did not receive a treatment during the last 14 days.
* **Arm Traffic Change:**
* If the experiment's segmentation changes (e.g., new arm, traffic of arm change), those changes do **not take effect immediately**.
* Instead, a **13-day buffer period** is enforced.
* During this period, users continue to be counted under their **original group**.
* **Event Counting Rule:**
* Events are counted **only after** the user receives their **first Auxia response of the day**.
* For example: if a user receives their first response at **12:00 PM on January 1**, only events occurring **after 12:00 PM** on that day will be counted.
* **Group Attribution:**
* The user activities are attributed only after a user receives a **first Auxia response of the day.**
* **Example:** If a user's first treatment occurs at 1:00 PM on January 12, all activities from 1:00 PM on January 12 through the next 13 days are attributed to that treatment.
* If the user's next treatment is on January 27, any activities between the end of the 13-day window (after January 25) and the time of the January 27 treatment are **not** attributed to Auxia.
* Users are classified as **treated** or **control** based on the experiment setup.
* **Treated group user:** The Engagement dashboard only counts events that occurred if a user received a treatment less than 14 days before.
* **Control group user:** The dashboard only counts events that occurred if the user did not receive a treatment during the last 14 days.
* **Arm Traffic Change:**
* If the experiment's segmentation changes (e.g., new arm, traffic of arm change), those changes do **not take effect immediately**.
* Instead, a **13-day buffer period** is enforced.
* During this period, users continue to be counted under their **original group**.
* **Event Counting Rule:**
* Events are counted **only after** the user receives their **first Auxia response of the day**.
* For example: if a user receives their first response at **12:00 PM on January 1**, only events occurring **after 12:00 PM** on that day will be counted.