
Engagement
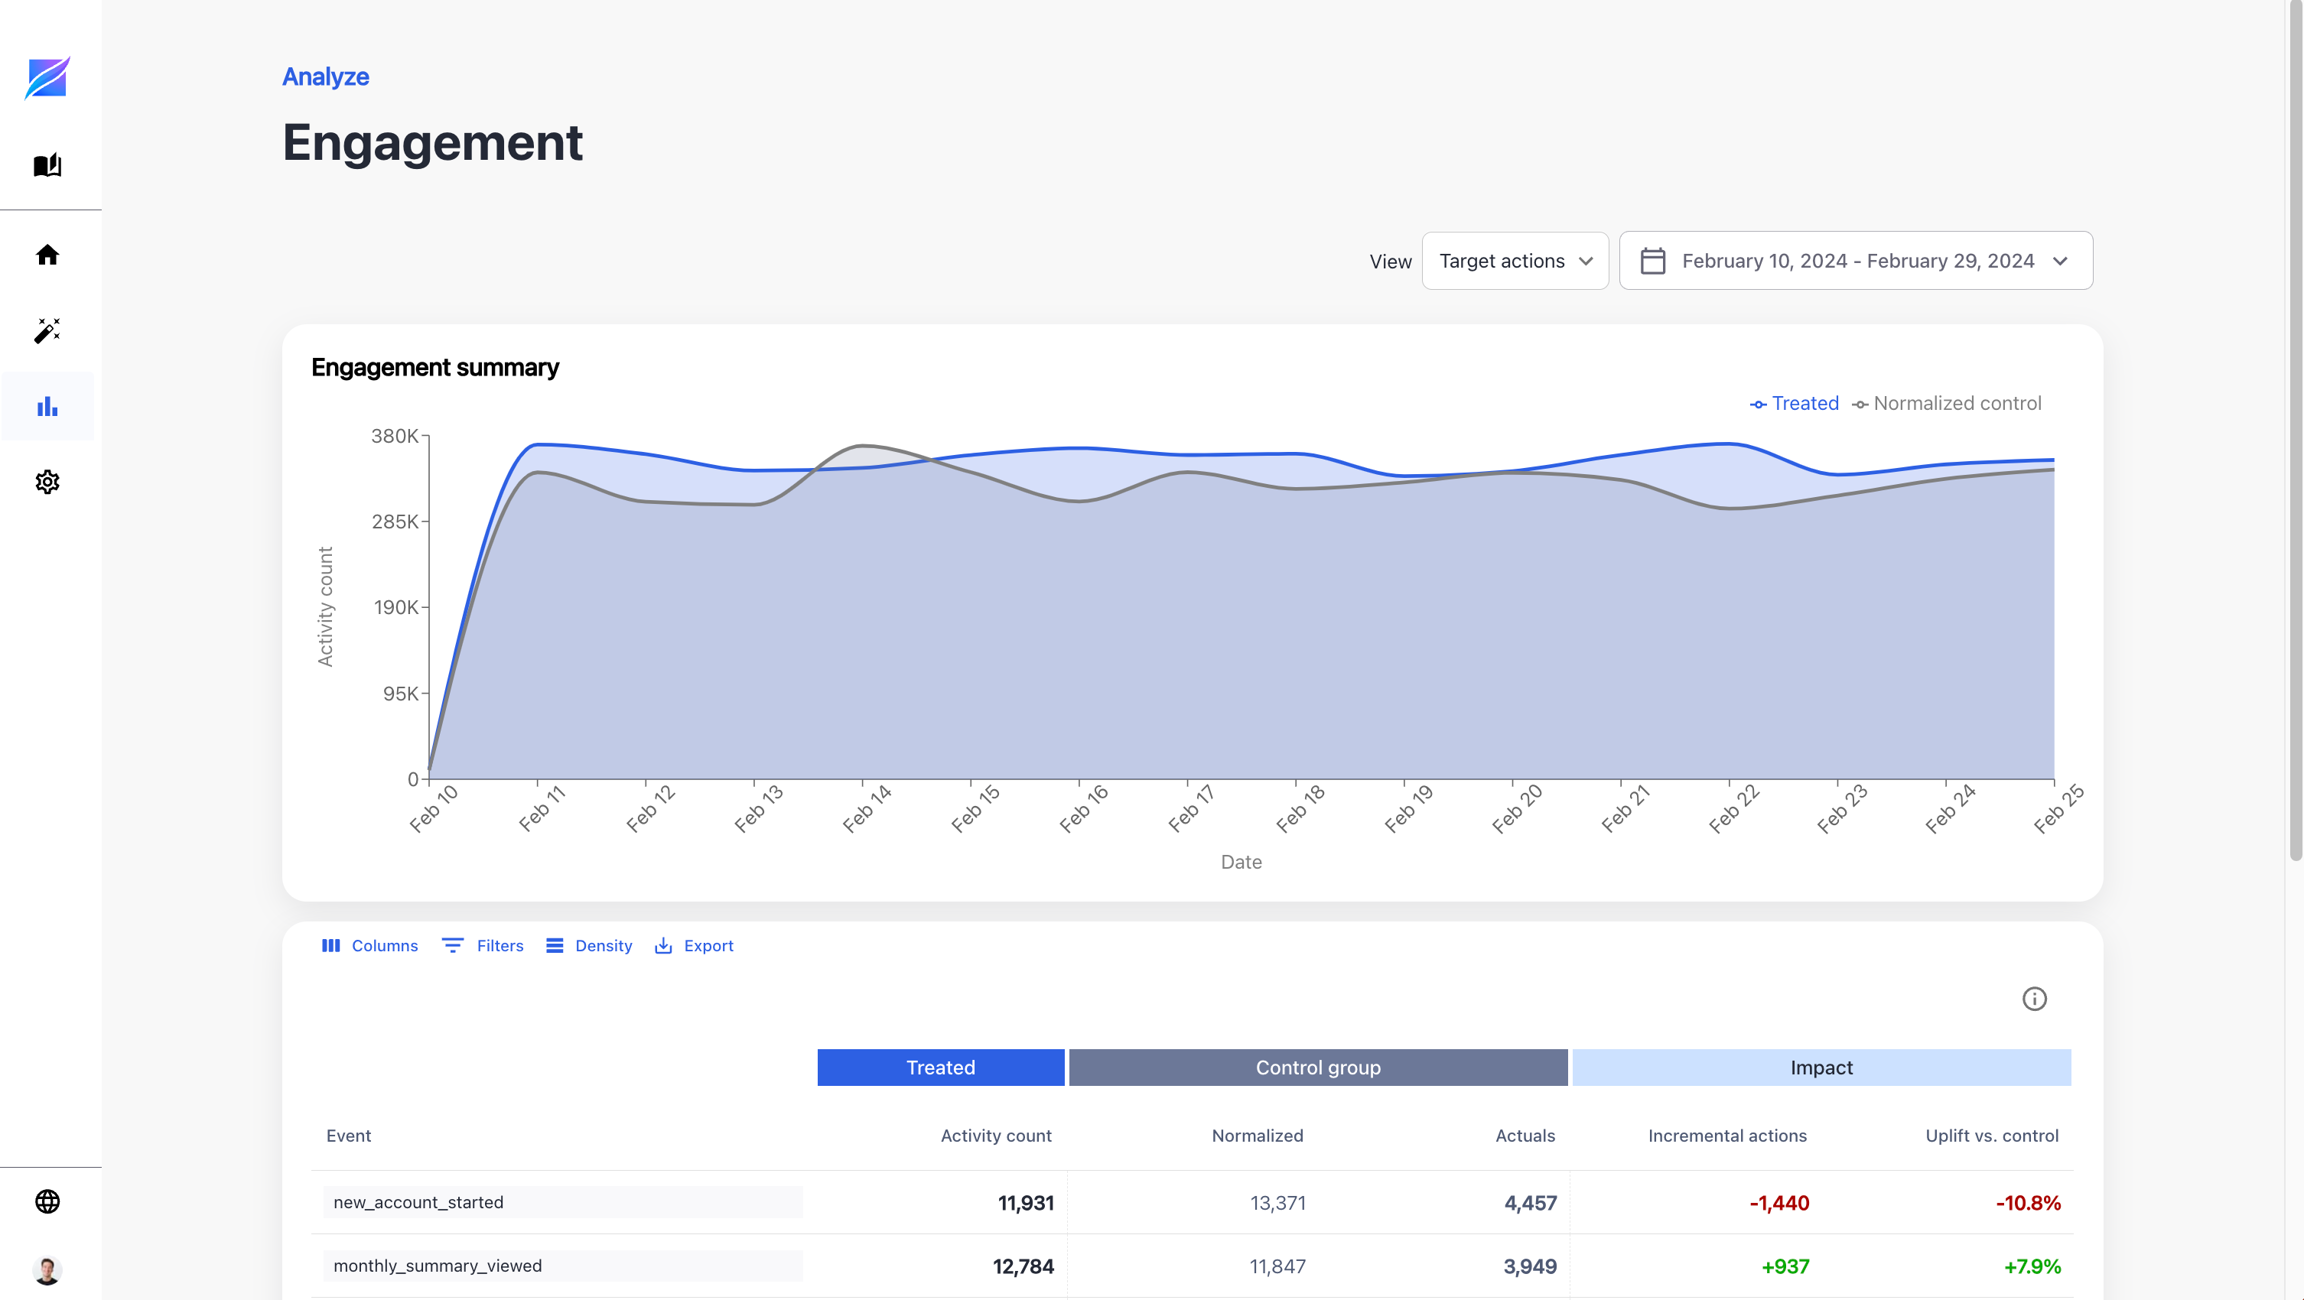
The Engagement page provides a consolidated view of Auxia's overall impact on key user behaviors and metrics. Unlike the Interactions and Adoptions dashboards, which highlight the relative impact across different treatments, this dashboard focuses on the total effect of running Auxia across your organization's most important KPIs—such as target actions (e.g., "purchase completed") and guardrail metrics (e.g., "item likes", "items saved").
Data Structure
The Engagement dashboard contains the following columns:
| Column | Description |
|---|---|
| Event | The specific user action ingested from your data sources. |
| (Treated) Activity Count | The total number of times users in the treated group performed the event. A treated user is one who has received a response from Auxia. |
| (Control) Actual Count | The total number of times users in the control group performed the event. A control user has not received any response from Auxia. |
| (Control) Normalized Count | The control count adjusted for group size imbalance: Control Actual Count × (Treated Group Size / Control Group Size). |
| (Impact) Incremental Actions | The difference between treated activity count and normalized control count. |
| (Impact) Uplift vs. Control | The percentage increase of treated over normalized control: (Incremental Actions ÷ Normalized Control Count) × 100. |
Computation Logic
The Engagement dashboard computes daily aggregates of the number of events that occurred during the specified time period in the date range.
Key Attribution Rules
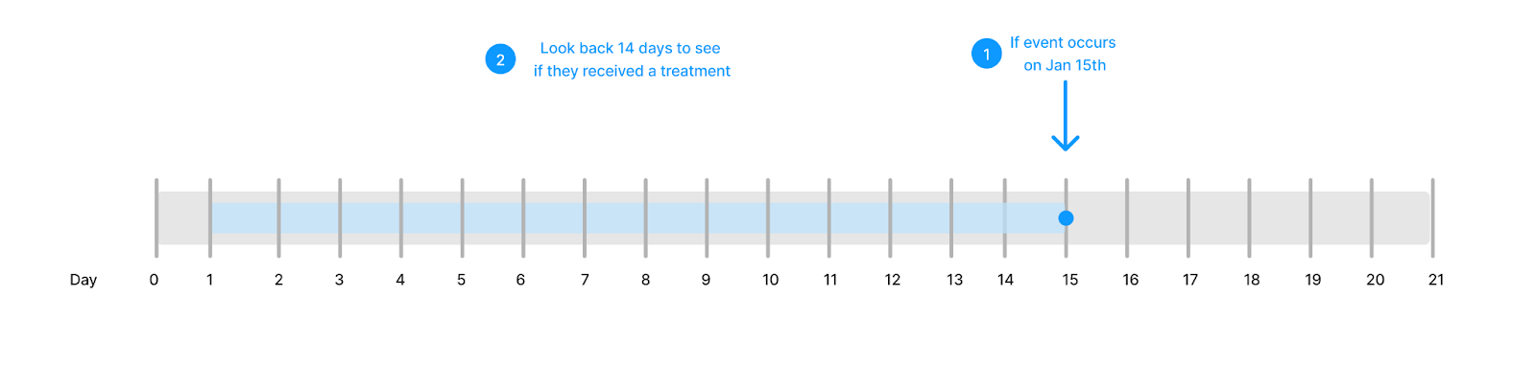
- Daily Aggregation: The dashboard reports daily aggregates of each event during the selected date range.The diagram below highlights an example of how the daily aggregates are computed.
-
Group Attribution:
- The user activities are attributed only after a user receives a first Auxia response of the day.
- Example: If a user's first treatment occurs at 1:00 PM on January 12, all activities from 1:00 PM on January 12 through the next 13 days are attributed to that treatment.
- If the user's next treatment is on January 27, any activities between the end of the 13-day window (after January 25) and the time of the January 27 treatment are not attributed to Auxia.
- Users are classified as treated or control based on the experiment setup.
- The user activities are attributed only after a user receives a first Auxia response of the day.
-
Treated group user: The Engagement dashboard only counts events that occurred if a user received a treatment less than 14 days before.
-
Control group user: The dashboard only counts events that occurred if the user did not receive a treatment during the last 14 days.
-
Arm Traffic Change:
- If the experiment's segmentation changes (e.g., new arm, traffic of arm change), those changes do not take effect immediately.
- Instead, a 13-day buffer period is enforced.
- During this period, users continue to be counted under their original group.
-
Event Counting Rule:
- Events are counted only after the user receives their first Auxia response of the day.
- For example: if a user receives their first response at 12:00 PM on January 1, only events occurring after 12:00 PM on that day will be counted.