Interactions
 The Interactions Dashboard
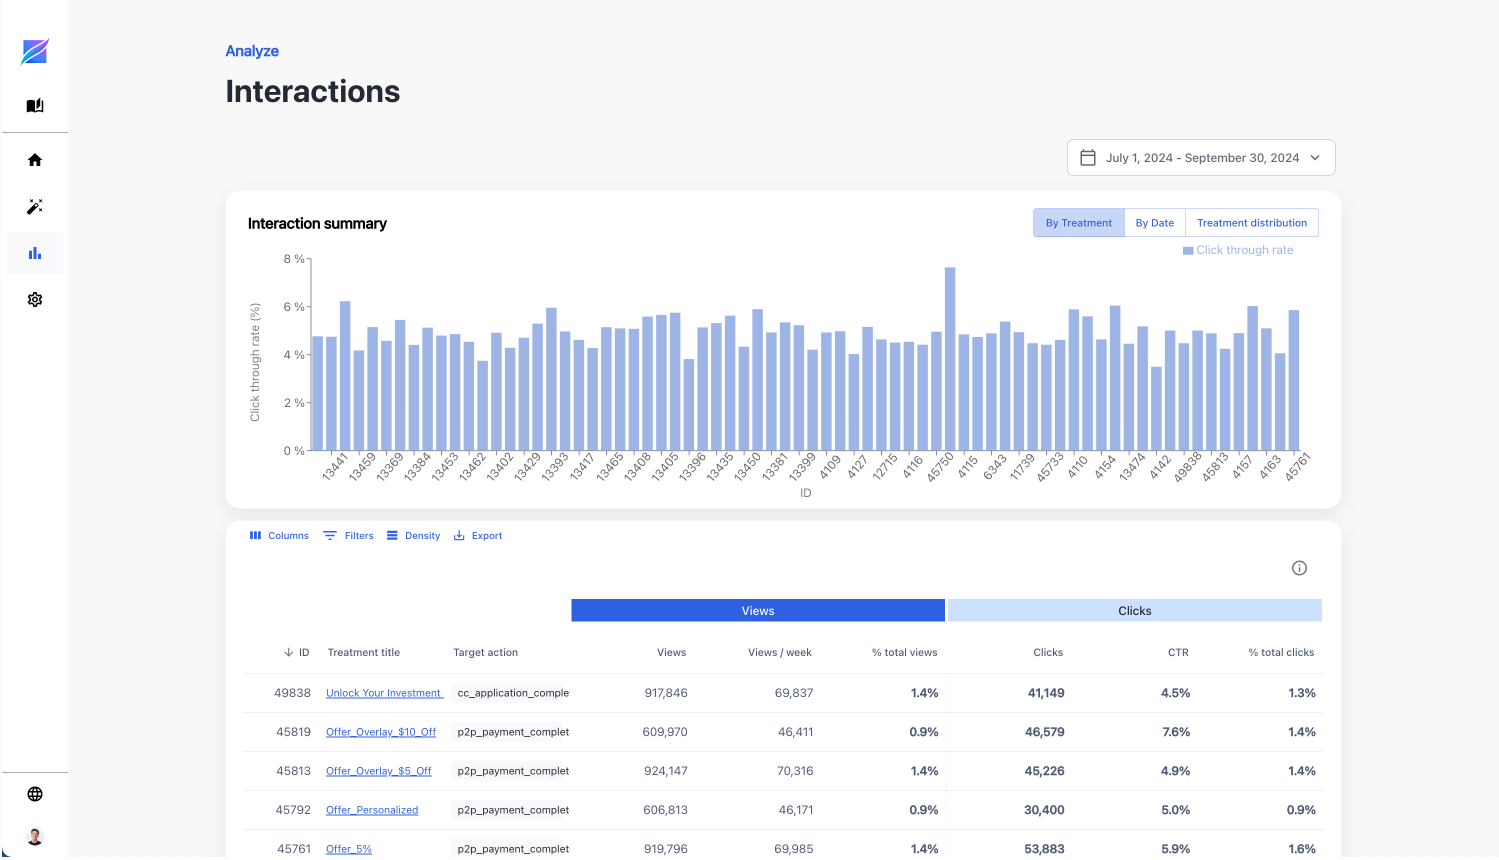
The image above highlights an example of the Interactions dashboard for a typical customer. It showcases how treatments were distributed and how the system learns over time.
The table here is comprised of the following columns:
- ID: Treatment Identification number in Auxia
- Treatment title: The name of the treatment. This is also hyperlinked to highlight the details of the treatment in side-panel preview when clicked
- Target action: The specific action you want your treatment to drive
- Views: Total number of times a treatment was viewed during the time frame selected (not unique views per user)
- % of Total views: "Views" for that individual treatment divided by the sum of all "Views" across all treatments
- Clicks: Total number of clicks on each treatment (not unique clicks per user)
- Click through rate (CTR): "Clicks" divided by "Views"
- % of Total clicks: "Clicks" for that individual treatment divided by the sum of all "Clicks" across all treatments